The Hot Hand Fallacy
A fallacy which never was
Behavioural economists and psychologists have uncovered a large number of cognitive biases. A significant portion of their research has centred on judgements about probability and chance. In this area, the hot hand fallacy is one of the most famous biases.
Fooled by randomness?
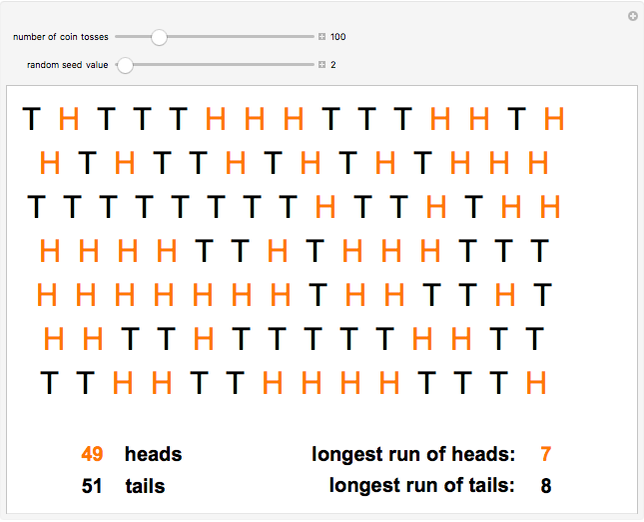
People often struggle to perfectly understand randomness. Imagine for instance that you were to throw a coin 100 times and record whether each throw is a Head or Tail. What do you think the sequence of outcomes would look like? Let’s answer this question using the Wolfram applet to generate consecutive Heads or Tails. Here is an example:
If you are like most people, you may be a bit surprised by the fact that this sequence contains very long streaks of H and T. Long streaks are expected to appear in random sequences. But psychological studies have found that people do not expect such streaks to appear when they imagine what a random sequence would look like (e.g. Wagenaar, 1972). As a consequence, when people are asked to generate a “random” sequence of H and T, they tend to avoid long streaks.
This fact raises an interesting perspective: faced with a sequence of actually random events, people may doubt that it is random when they observe a long streak. They may even try to come up with a spurious explanation for why this streak appeared.
It is likely this intuition that motivated Gilovich, Vallone and Tversky (1985) to go after one of the biggest folk psychology tales in basketball: the hot hand. The idea behind the hot hand is simple. After shooting successfully several times, a player may get in the zone and become more assured and precise in his/her shots, leading to an even higher chance of success in later shot attempts. We say of such a situation that the player has the “hot hand”. Teammates may want to preferentially pass the ball to this player to increase the chances of success of the team.
Armed with their insight from psychology, Gilovich, Vallone and Tversky confronted this widely shared perception head-on. They looked at sequences of throw attempts to study whether successful shots are more likely to occur after a series of previous successful shots. The answer to this question turned out to be negative: they found no increase in the frequency of success after a series of successful shots. They, therefore, observed that there was no evidence of the hot hand. It was a cognitive illusion, and the claim that it was real was a fallacy.
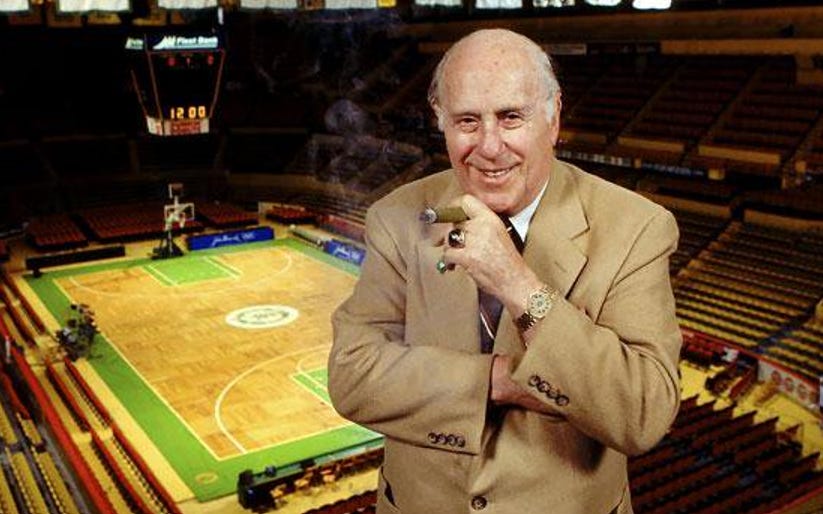
This result collided with a widely shared view in basketball about the existence of the hot hand. Boston Celtics coach Red Auerbach retorted: “Who is this guy? So, he makes a study. I couldn’t care less.” Beyond basketball, it was in conflict with the popular notion of momentum, the idea that athletes’ performance can improve after a string of positive results. Ten years before Gilovich, Vallone, and Tversky’s study, the psychologists Taylor and Demick (1994) had described momentum as “one of the most commonly referred to and least understood phenomena in the realm of sports”.
The concept of momentum is one of the most commonly referred to and least understood phenomena in the realm of sports" - Taylor and Demick (1994)
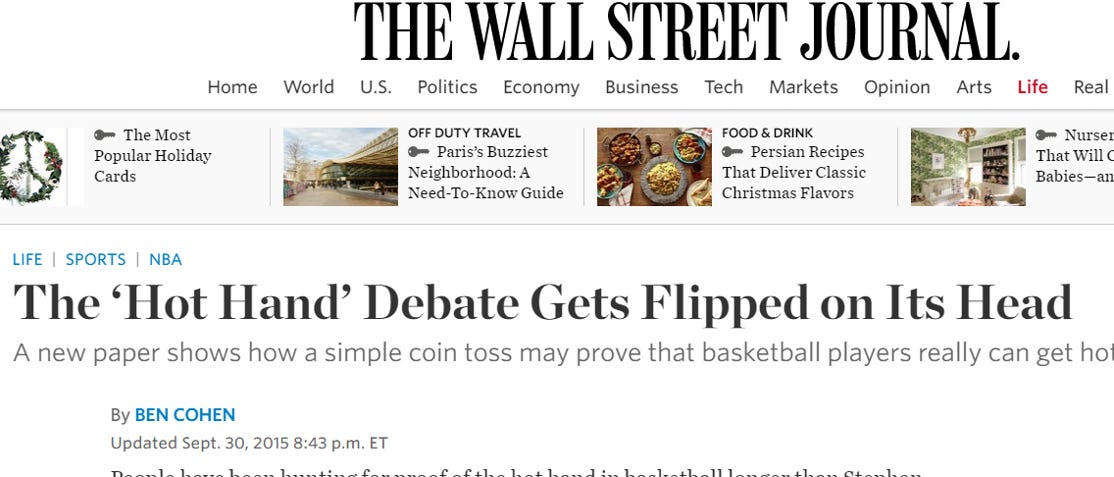
Overturning the prevailing wisdom among sports practitioners, the idea that the hot hand is an illusion became the consensus in psychology. More than that, the “hot hand fallacy” soon turned into one of the most iconic “biases” in behavioural economics. It offered a great example of cognitive illusion to illustrate the power of behavioural economics in its ability to uncover the flaws of human psychology.
The popularity of the hot hand as a poster child for behavioural economics is easy to understand. A lot of the biases uncovered by behavioural economics were departures from somewhat abstract principles of consistency. With the hot hand, behavioural economists were able to point to a cognitive bias generating a widely popular idea about a major sport.
“I’ve been in a thousand arguments over this topic, won them all, but convinced no one” - Amos Tversky (cited in Bar-Eli et al. 2006)
“Many researchers have been so sure that the original Gilovich results were wrong that they set out to find the hot hand. To date, no one has found it.” - Richard Thaler and Cass Sunstein (Nudge, 2008)
“the sequence of successes and missed shots satisfies all tests of randomness. The hot hand is entirely in the eye of beholders, who are consistently too quick to perceive order and causality in randomness. The hot hand is a massive and widespread cognitive illusion.” - Daniel Kahneman (Thinking fast and Slow 2011)
The fall of the fallacy
Undeterred by the cemented institutional consensus about the absence of a hot hand, two young economists, Joshua Miller and Adam Sanjurjo started questioning whether the hot hand really does not exist. They turned back to the data. What they found was surprising: the way researchers had used empirical observations to dispel the existence of a hot hand was wrong.
Their argument is subtle, and fascinating because it is counter-intuitive. To get an idea, let’s suppose you wanted to test whether you are more likely to get a Head (H) rather than a Tail (T) after a Head when throwing a coin. Assuming the coin is fair, the answer is obviously no. Whether the previous throw was a H or a T, your probability to get H is always 50%. If you are not convinced, you may want to check the Gambler’s fallacy.
But Miller and Sanjurjo’s surprising finding is that this 50% probability is not what you observe if you look at the frequency of Hs after a H. To see that fact, let’s look at an example. Suppose you throw, a fair coin repeatedly three times. There are 8 possible sequences of 3 outcomes. The table below shows each possible sequence. For each sequence, it indicates in the second column the proportion of H observed after a H.
You have the same probability of getting any of these sequences, so the expectation of observing H after one H is the average of the frequencies of H occurring after a H in all the sequences. Note that this expectation is not 50%, but less than that! How could it be? The reason is that, when you condition on observing something after a H, you introduce a subtle sampling bias. This bias is in part due to the fact that looking at a throw after a H is akin to removing this H from the possible observations. If you started with a number n of H in your sample, now you are looking at a sample where there are n-1 H left. You are less likely to observe a H after a H as a consequence.
The bias found by Miller and Sanjurjo would only disappear if you were to throw the coin a very large number of times. But whenever you have a limited number of observations (here coin throws), looking at the probability of success after a string of successes will lead to an estimate of the probability that is biased downward.1
This result is critical. It means that the test used by Gilovich, Vallone and Tversky was biased towards rejecting the hot hand. Whatever the actual probability of scoring after a streak of success, their test on a limited number of observations would give a smaller estimate than the actual probability. In particular, if players have a higher probability than average to score after a successful shot, the test they used may conclude that it is not the case.
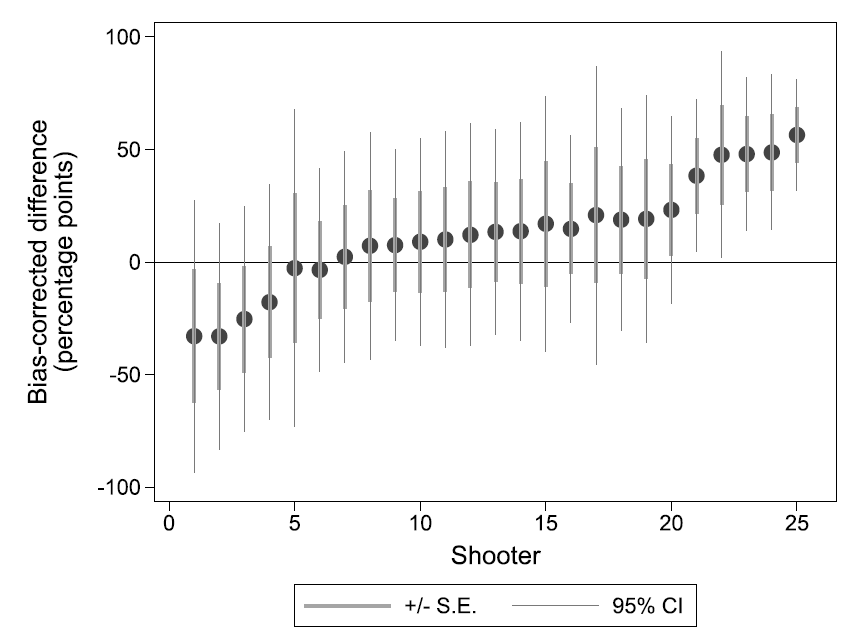
Miller and Sanjurjo reanalysed Gilovich, Vallone and Tversky’s data and found that the hot hand was actually present there! They got the same conclusion looking at other studies on the hot hand by researchers who had also rejected the hot hand using the same initial approach.
Time for some game theory
Convinced that people were hallucinating about the existence of the hot hand, behavioural economists had for many years dismissed the idea of momentum in sports as a cognitive illusion. But let’s think about it. Should we expect players’ performance to be constant throughout a match?
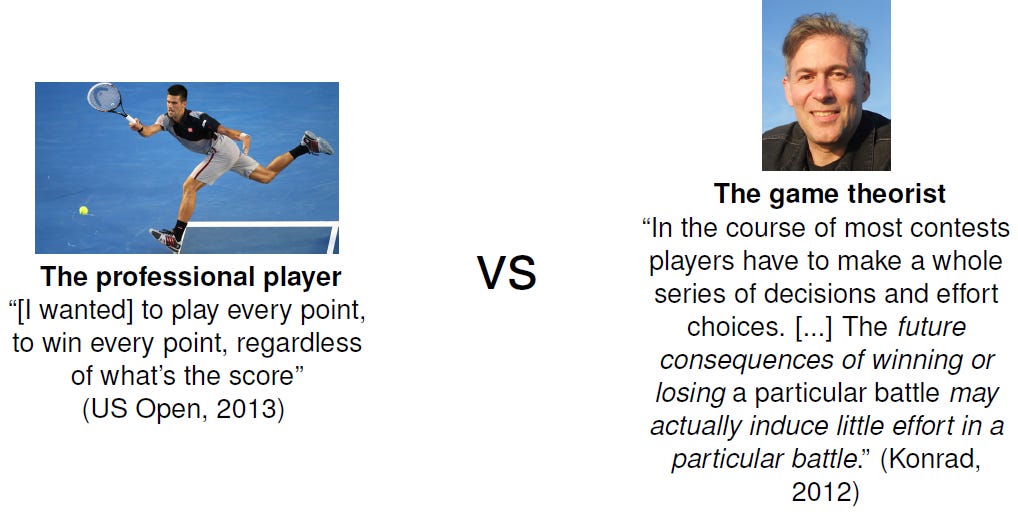
Players have often suggested it is the case in post-match interviews by stating that they play every point 100% (if not more). Perhaps we should take the players’ statements with a pinch of salt, though. It would possibly not be the best PR strategy to tell your fans you are not trying your best all the time.
Looking at the players’ actual incentives, game theory suggests players should not maintain a constant intensity during a match. Instead, players should strategically modulate their effort, and therefore their performance, as a function of their past performance
There are at least two reasons for this. First, when players’ relative position with their opponents changes in a game, the relative costs and benefits of their effort change as well. A key intuition—reached by several models of contests taking place over time—is that there is a difference in incentives between a leading and a trailing contestant. In short, the leading contestants’ reward for achieving further success can be winning the whole match, which is a big prize. For the trailing contestant, the reward ahead is to catch up, which only corresponds to having a shot at winning later, after additional efforts. As a consequence, a leading contestant may have a higher motivation to win the next round/period in the game.
The second reason is that players may have incomplete information about their strength and the strength of their opponent. After being successful, they may learn that they are likely stronger than their opponent. This, in turn, can create an asymmetry in motivation between successful and unsuccessful players with the players ahead being more motivated as they are more convinced that their effort will pay off.
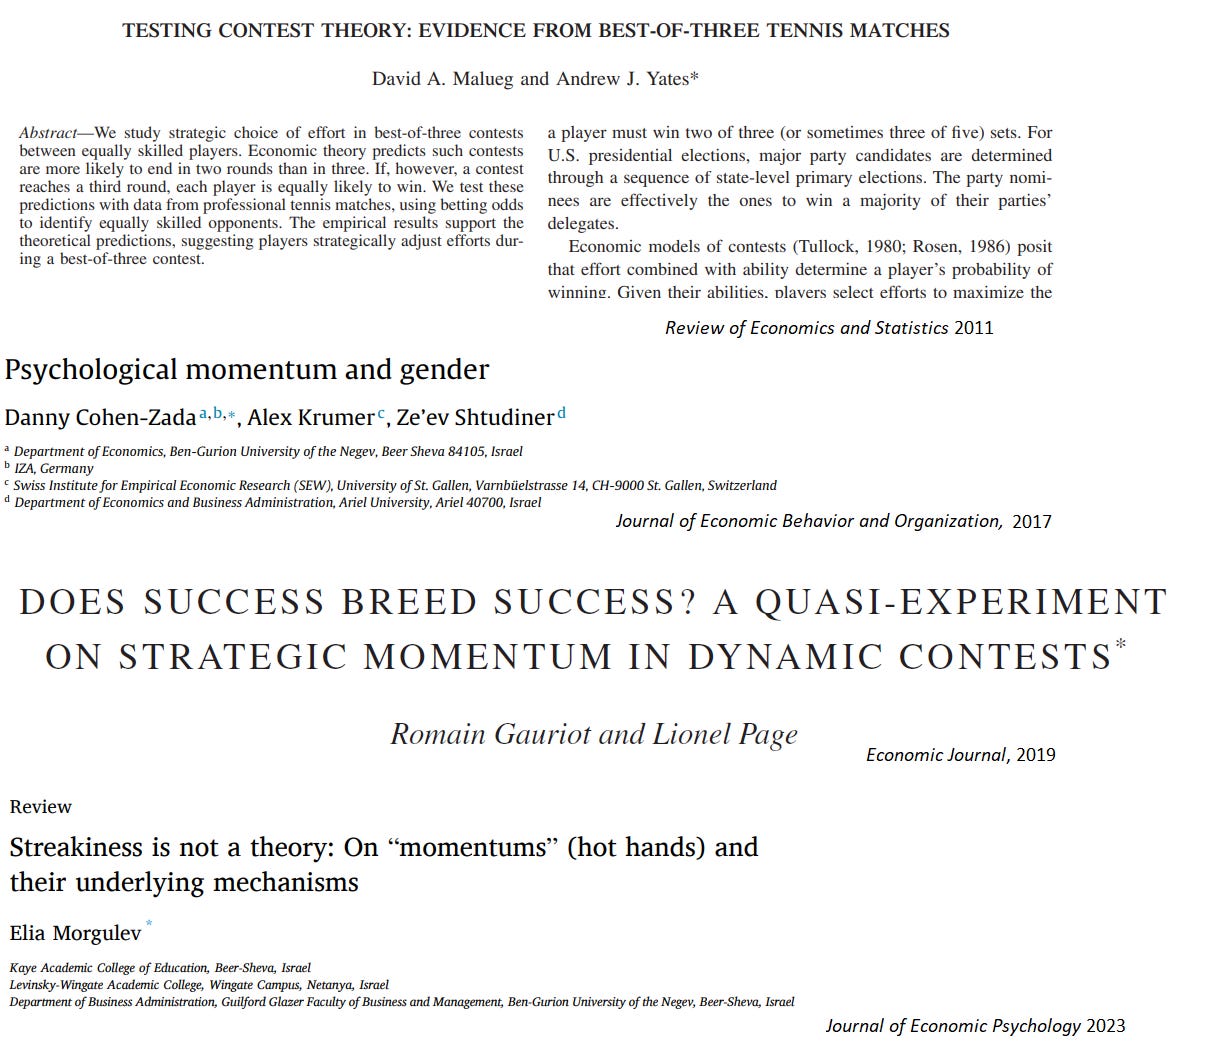
This game theoretic perspective has informed many studies in economics that have confirmed the existence of momentum in different sports such as tennis, judo, and golf. These game theoretical insights mean that not only can momentum exist in contests, but that it is indeed what we should expect to observe.
A basketball match is more complex to analyse than matches composed of discrete rounds like tennis or golf. But the mechanisms isolated by game theoretical models can very well be at play there too: as a team starts leading, additional successful shots increase the chance of securing a victory. While the trailing team now plays to catch up. This may induce small variations in effort and chances of success. At the level of players, the fact of being successful at several attempts may increase the players’ confidence that he/she is able to be successful in the specific context of this match. This can bolster the player’s focus and effort.
These explanations may not be the only ones for the hot hand. Physiological factors, like muscle memory, could also be at play. But importantly, they show that the assumption no momentum should exist was simplistic. It ignored the players’ strategic considerations during a match. In some of my own research, I have found that, in the case of tennis, the game theoretic explanation is fairly good at predicting the patterns of momentum in the game.
There is an important lesson in this story. For three decades, behavioural economists lectured sports athletes, coaches and commentators for being wrong on something they had deep expertise in. What eventually appeared is that it was the behavioural economists who had misperceived a bias when none existed. The beliefs of sports practitioners were in line with reality: the hot hand exists. And this phenomenon has very good reasons to exist. We would expect it to arise from the players’ strategic behaviour.
As the hot hand fallacy has been an iconic example of the notion that people are riddled with cognitive biases, its demise has become a symbol that behavioural economists may have been too eager to label unexplained behavioural patterns as “biases”. In the end, the hot hand happens to be reinstated at a time when there is a renewed interest in a more optimistic view of human behaviour that looks for the good reasons behind behavioural patterns.
This post is the first of three instalments that will show how iconic “biases” turned out not to be biases. The next post will be on the confirmation bias. To get notifications of future posts you can subscribe. The content of this Substack is free.
I thank Joshua B. Miller for providing feedback about his research and kindly providing me with several of the sources for this post.
References
Bar-Eli, M., Avugos, S. and Raab, M., 2006. Twenty years of “hot hand” research: Review and critique. Psychology of Sport and Exercise, 7(6), pp.525-553.
Gilovich, T., Vallone, R. and Tversky, A., 1985. The hot hand in basketball: On the misperception of random sequences. Cognitive psychology, 17(3), pp.295-314.
Kahneman, D., 2011. Thinking, fast and slow. Macmillan.
Konrad, K.A., 2009. Strategy and dynamics in contests. OUP Catalogue.
Konrad, K.A., 2012. Dynamic contests and the discouragement effect. Revue d'économie politique, (2), pp.233-256.
Miller, J.B. and Sanjurjo, A., 2018. Surprised by the hot hand fallacy? A truth in the law of small numbers. Econometrica, 86(6), pp.2019-2047.
Taylor, J. and Demick, A., 1994. A multidimensional model of momentum in sports. Journal of Applied Sport Psychology, 6(1), pp.51-70.
Thaler, R. and Sunstein, C., 2008. Nudge: The gentle power of choice architecture. New Haven, Conn.: Yale.
Wagenaar, W.A., 1972. Generation of random sequences by human subjects: A critical survey of literature. Psychological Bulletin, 77(1), p.65.
Yule, G.U., 1926. Why do we sometimes get nonsense-correlations between Time-Series?--a study in sampling and the nature of time-series. Journal of the royal statistical society, 89(1), pp.1-63.
For the statistically minded readers: This bias is linked to the one identified by Yule (1926) whereby estimates of serial correlation are biased downward in small samples. Miller and Sanjurjo also identified another—less intuitive—aspect of the downward bias that increases its magnitude, which they describe here.
If you want to try to see the overall bias by yourself using simulations, here are a few lines of code to generate 1,000 samples of 100 draws from a Bernoulli distribution and test whether a “1” is more likely to be observed after three “1” in a row occurred. You’ll find that the probability to observe a “1” after a series of three “1” is around 46%.
In STATA:
program hothand, rclass

      clear

      set obs 100

      gen random=round(runiform())

      mean random if random[_n-1]==1&random[_n-2]==1&random[_n-3]==1

end

simulate, reps(1000): hothand

sum
In R:
# Define the simulation function

hothand <- function() {

# Generate a sequence of 100 Bernoulli draws

random <- rbinom(100, 1, 0.5)

# Initialize an empty vector for storing results

result <- c()

# For every element of the sequence

for (i in 4:length(random)) {

# If the previous three elements are all 1s, append the current element to result

if (all(random[(i-3):(i-1)] == 1)) {

result <- c(result, random[i])

}

}

# Return the mean of the results

return(mean(result))

}

# Run the simulation 1000 times and store the results

results <- replicate(1000, hothand())

# Compute and print the summary of the results

summary(results)



I knew it. Admittedly, I always objected on other grounds, namely that basketball shots are not all alike. Sometimes the “hot hand” is just a defensive breakdown leading to wide open threes. Also, it seemed wildly implausible that someone getting fouled hard would have no effect on subsequent free throws, and so on.
Miller and Sanjurjo’s table arriving at 5/12s seems bogus. To quote someone on r/slatestarcodex:
Anyone can easily check there are eight post-heads results available. Four of them are heads, four tails. That's 50%. I think the authors reached 5/12 by averaging the "proportion of Hs on recorded flips" in each scenario, which just seems wrong.
Maybe that commenter is wrong. I'm open to persuasion.