The Game Theory Behind the Price to Refuel your Car
Why fuel prices often follow regular cycles
I have made the point in this Substack that the insights of game theory can be seen everywhere in society. In this post, I illustrate this point with something that interests most people who drive a car: How are petrol prices set? Specifically, I’ll unpack what seems at first quite mysterious: fuel price cycles.
The evidence on price cycles
In many countries, petrol prices do something strange: They follow regular cycles. At first glance, these price cycles are perplexing. Characterised by a rapid price hike followed by a gradual decline, they seem decoupled from fluctuations in global fuel prices. Here is, for instance, a graph of the cycles for three Australian cities. The cycles are not synchronised and so must emerge as a result of local market dynamics.
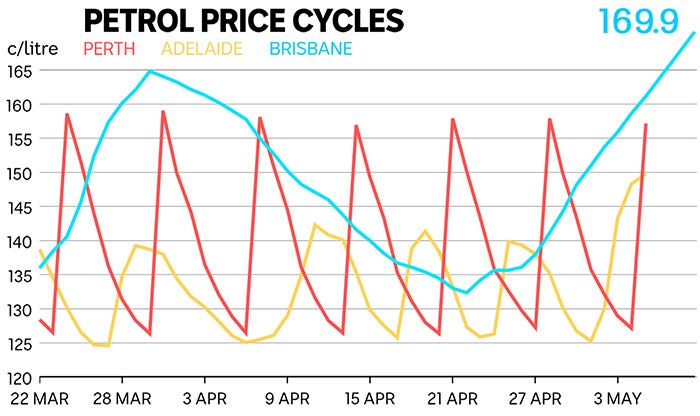
Such pricing cycles are not unique to Australia; they have been observed in multiple countries, including Austria, Canada, Germany, Norway, and the US Midwest.

Why do they exist?
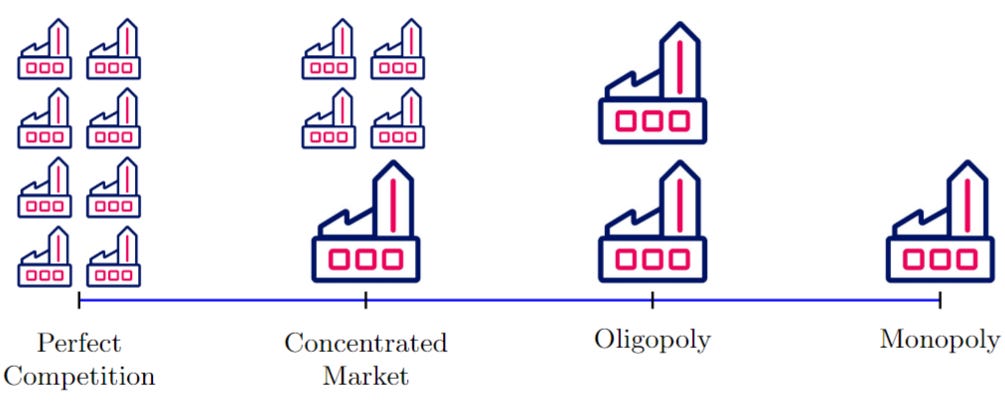
These cycles have a name: Edgeworth cycles, following the economist Francis Y. Edgeworth’s suggestion that prices could follow cycles in markets where competition is not perfect. Markets can feature different degrees of competition. At one end, you find highly competitive markets dominated by numerous small companies. Here, competitive forces naturally drive prices down. At the other end, you have monopolistic markets with a single actor. In both these extremes, the decisions of one firm don't exert influence over others. The former case features firms too small to impact the market, and the latter case involves no other firms to influence.
In between perfect competition and monopoly, there are situations where markets feature a few large firms (oligopoly, concentrated market). It is in this context that game theory becomes particularly instructive. Decisions made by a large firm in such a setting will invariably influence the strategic choices of its competitors.
When companies act with strategic intent, they often recognise the mutual benefits of reducing competition to sustain higher prices. While explicit collusion of this sort is generally illegal, coordination can manifest in subtler forms.
In a previous post, I described how the philosopher David Lewis (1969) employed game theory to understand real-world coordination problems. Lewis notably highlighted the role of signals—actions imbued with specific meanings—as a mechanism for conveying strategic intentions. For example, activating a car's right indicator communicates an intention to turn right to other road users.
Such signalling often evolves into conventions among a group of players seeking to coordinate (Skyrms, 2010). This can happen without an explicit agreement but as a tacit agreement. David Lewis precisely used an oligopolistic situation as an example to illustrate this point: a few large firms can tacitly signal to each other how to establish a new price without needing an explicit agreement.
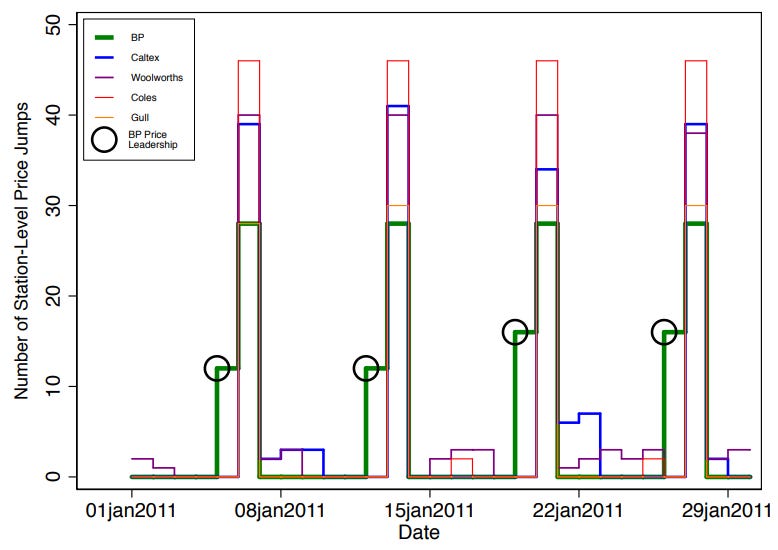
Finding out these coordination activities in markets is not easy. Averaged prices over a region or time span often mask such signalling and coordination via prices. Looking at car fuel markets, economists David Byrne and Nicolas de Roos have, however, been able to find the clear fingerprints of the tacitly collusive strategy suggested by David Lewis. In a 2019 study zooming in on day-by-day prices at the station level in the state of Western Australia, they stumbled on a striking finding. A day before the start of a new cycle, BP—the market leader—was the first to raise its price at selected stations.
This jump in price in selected stations is picked up as a signal by other competitors who then coordinate on the new price on the following day. Subsequent analyses found similar patterns in the states of Victoria and New South Wales, and in Germany.1 Further observations reveal that the stations acting as signals sometimes raise their price only temporarily. They also tend to be isolated and not face competition from nearby stations.2 These two aspects limit the cost of initiating the price increase for the market leader.
So the big firms coordinate using subtle price signals.3 Yet, the presence of cycles remains puzzling: why don't prices stay at their peak levels? Here the evidence suggests that the presence of many small operators makes it hard to sustain coordination on a high price. Major chains, usually benefiting from prime locations and a loyal consumer base, are less sensitive to minor price alterations. Conversely, independent stations attract a more price-sensitive clientele, making them more inclined to instigate price cuts. This initiates a phase of successive price reductions by smaller entities, eventually followed by the market leaders. We could describe these cycles as the reflection of an imperfect tacit collusion.
The graph below unpacks these mechanisms driving cycles up and down (Byrne et al. 2023). It shows the average prices for each major retailer around Melbourne. These companies represent more than 50% of the market share. Most of them are supermarket chains that add a petrol station in the vicinity of their stores. The market leader in the area, Coles (and to some extent BP), initiates the price cycles. A hike is followed by an undercutting phase where Coles tends to be last to reduce its prices.
Consumer information… backfiring
To help consumers find cheaper petrol and enforce competition on fuel prices, governments have sometimes opted to increase the customers’ information about the prices at the different stations in an area. In Australia, retailers are mandated to report their prices. These are then listed on freely accessible apps. Consumers can use these apps to shop around for the best prices. It seems like an economist's dream to create a competitive market.
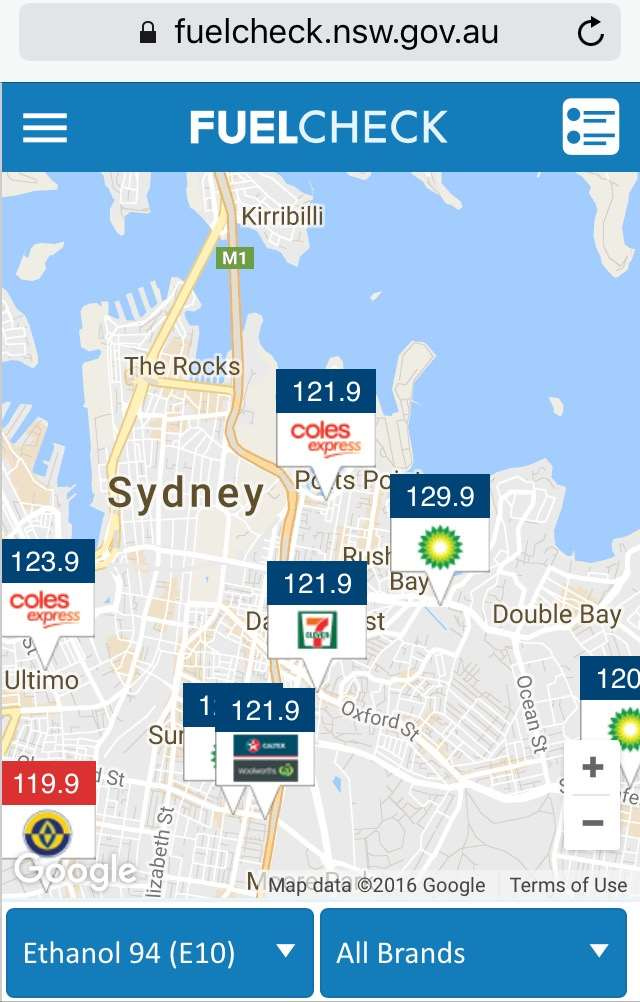
Unfortunately… these apps may primarily help the retailers to coordinate! The problem is that only a minority of consumers actually use these apps to modify their buying behaviour sufficiently to discipline retailers. Conversely, these platforms offer retailers a cost-free mechanism to monitor competitor pricing and enhance their coordination.
If you are a consumer facing such cycles, there is nevertheless some information you can glean from this post. Look for the phase of the cycle where the price stops decreasing. It suggests retail prices are close to the wholesale prices. You are towards the end of the undercutting phase and getting closer to the upswing phase. If you are attentive you can even notice the first movers in the upswing phase. When this is the case, you should fill your tank in the remaining stations with low prices.
OK, but why does it only happen with fuel prices?
Well… it doesn’t!
A recent paper found a similar cycle behind the prices found on Amazon when you click on the “Buy now” box, the so-called Buybox. What most customers do not know is that clicking on this box allocates your order to a seller who is selected by Amazon for having a low price. A sizable 83% of purchases on Amazon go through the Buybox. Being the selected vendor behind it is therefore highly valuable.
Behind the scenes, sellers compete to “own’’ the Buybox. One might expect that this competition would keep prices low. However, using extremely precise data, Musolff (2022) found very small cycles. They are so small and quick, they could be described as quantum price cycles. They last on average 1.67h and have an average amplitude of $0.10! They are characterised by spikes in prices, followed by quick undercuts with a median value change of $0.02.
These cycles are generated by automatic algorithms that compete for access to the Buybox, but also de facto tacitly collude to avoid staying at a very low price. The price leader is Amazon itself which owns the Buybox when its price matches those of third-party vendors vying for the box. The figure below shows these cycles between Amazon (red) and a third-party vendor (green) competing for the Buybox to sell sporting shoes.

Contrary to the fuel prices cycles, these cycles behind the Buybox have a small amplitude, but they suggest a level of tacit collusion which could imply that prices overall may be higher than in perfect competition.
In any case, finding such price cycles in markets beyond fuel prices is striking. As Noel (2008) highlighted, “in most cases where cycles are newly found, it is because finer and newly available data reveal previously hidden cycles.” The findings on price cycles and on the signalling strategies firms follow to coordinate have been made possible by the much higher precision of prices now available to researchers. Better-quality data might reveal such cycles in a number of other markets.
I thank David Byrne for providing feedback about his research and kindly providing me with several of the sources for this post.
This post is part of a series on how game theory helps us make sense of a wide range of social behaviours. In previous posts, I wrote a quick introduction to game theory; I showed how it is strikingly effective at explaining tennis players’ strategies; and how it helps us understand social norms.
Disclaimer: The interpretations of all results are mine and/or those of the authors of the cited articles. They do not necessarily represent those of the Australian Competition and Consumer Commission or of the Australian Government. Any references to collusion in this post are strictly in the economic and not legal sense.
References
Boehnke, J., 2017. Pricing Strategies and Competition: Evidence from the Austrian and German Retail Gasoline Markets. Harvard University, Center of Mathematical Sciences and Applications.
Byrne, D.P. and De Roos, N., 2019. Learning to coordinate: A study in retail gasoline. American Economic Review, 109(2), pp.591-619.
Byrne, D.P., de Roos, N., Grinberg, A.R. and Marx, L.M., 2022. Informed Sources and the Role of Platforms for Facilitating Anticompetitive Communication.
Byrne, D.P., de Roos, N., Lewis, M.S., Marx, L.M. and Wu, X.A., 2023. Asymmetric Information Sharing in Oligopoly: A Natural Experiment in Retail Gasoline. Available at SSRN 4513435.
Cabral, L., Durr, N.S., Schober, D. and Woll, O., 2018. Learning Collusion: Theory and Evidence from the Shell Price Matching Guarantee.
Cason, T.N., Friedman, D. and Hopkins, E., 2021. An experimental investigation of price dispersion and cycles. Journal of Political Economy, 129(3), pp.789-841.
Chien, Y. and Morris, P., 2016. Filling the Tank on Fridays May Be a Bad Idea for St. Louisans. Economic Synopses. Federal Reserve of St Louis.
Eckert, A., 2003. Retail price cycles and the presence of small firms. International journal of industrial organization, 21(2), pp.151-170.
Edgeworth, F.Y., 1925. Papers relating to political economy (Vol. 2). Royal Economic Society by Macmillan and Company, limited.
Fershtman, C. and Fishman, A., 1992. Price cycles and booms: dynamic search equilibrium. The American Economic Review, pp.1221-1233.
Foros, Ø., Nguyen-Ones, M. and Steen, F., 2021. The effects of a day off from retail price competition: evidence on consumer behavior and firm performance in gasoline retailing. International Journal of the Economics of Business, 28(1), pp.49-87.
Lewis, D., 1969/2008. Convention: A philosophical study. John Wiley & Sons.
Maskin, E. and Tirole, J., 1988. A theory of dynamic oligopoly, II: Price competition, kinked demand curves, and Edgeworth cycles. Econometrica: Journal of the Econometric Society, pp.571-599.
Musolff, L., 2022, July. Algorithmic pricing facilitates tacit collusion: Evidence from e-commerce. In Proceedings of the 23rd ACM Conference on Economics and Computation (pp. 32-33).
Noel, M.D., 2008. Edgeworth price cycles and focal prices: Computational dynamic Markov equilibria. Journal of Economics & Management Strategy, 17(2), pp.345-377.
Noel, M.D., 2015. Do Edgeworth price cycles lead to higher or lower prices?. International Journal of Industrial Organization, 42, pp.81-93.
Skyrms, B., 2010. Signals: Evolution, learning, and information. OUP Oxford.
An analysis of the location of the “signalling” stations shows that they are selected to be out of the main urban area and in locations with less competition. Hence they are in locations where it is less costly to be the first to raise prices. The figure below shows this pattern in the case of Sydney (Byrne et al. 2023).
A similar careful decomposition of the evolution over time of different retailers’ prices identified the role of ARAL and Shell as price leaders in the intraday cycles occurring in Germany (Cabral et al. 2018).
For the economists reading this post: several theoretical explanations of these cycles have been proposed. Maskin and Tirole (1988) famously proposed a theoretical model predicting such cycles with a duopoly composed of two firms of the same size. Another strand of literature has pointed out the possible role of search costs for customers in leading to such cycles (Fershtman and Fishman, 1992; Cason, et al. 2021). The evidence in this post points to a coordination around a price leader, likely to emerge in markets with an asymmetry between one or a few large firms and many small firms. The emergence of Edgeworth cycles in such markets was modelled by Eckert (2003).


